Polaris BSM
Discover our comprehensive Industry 4.0 solutions for your digital transformation.
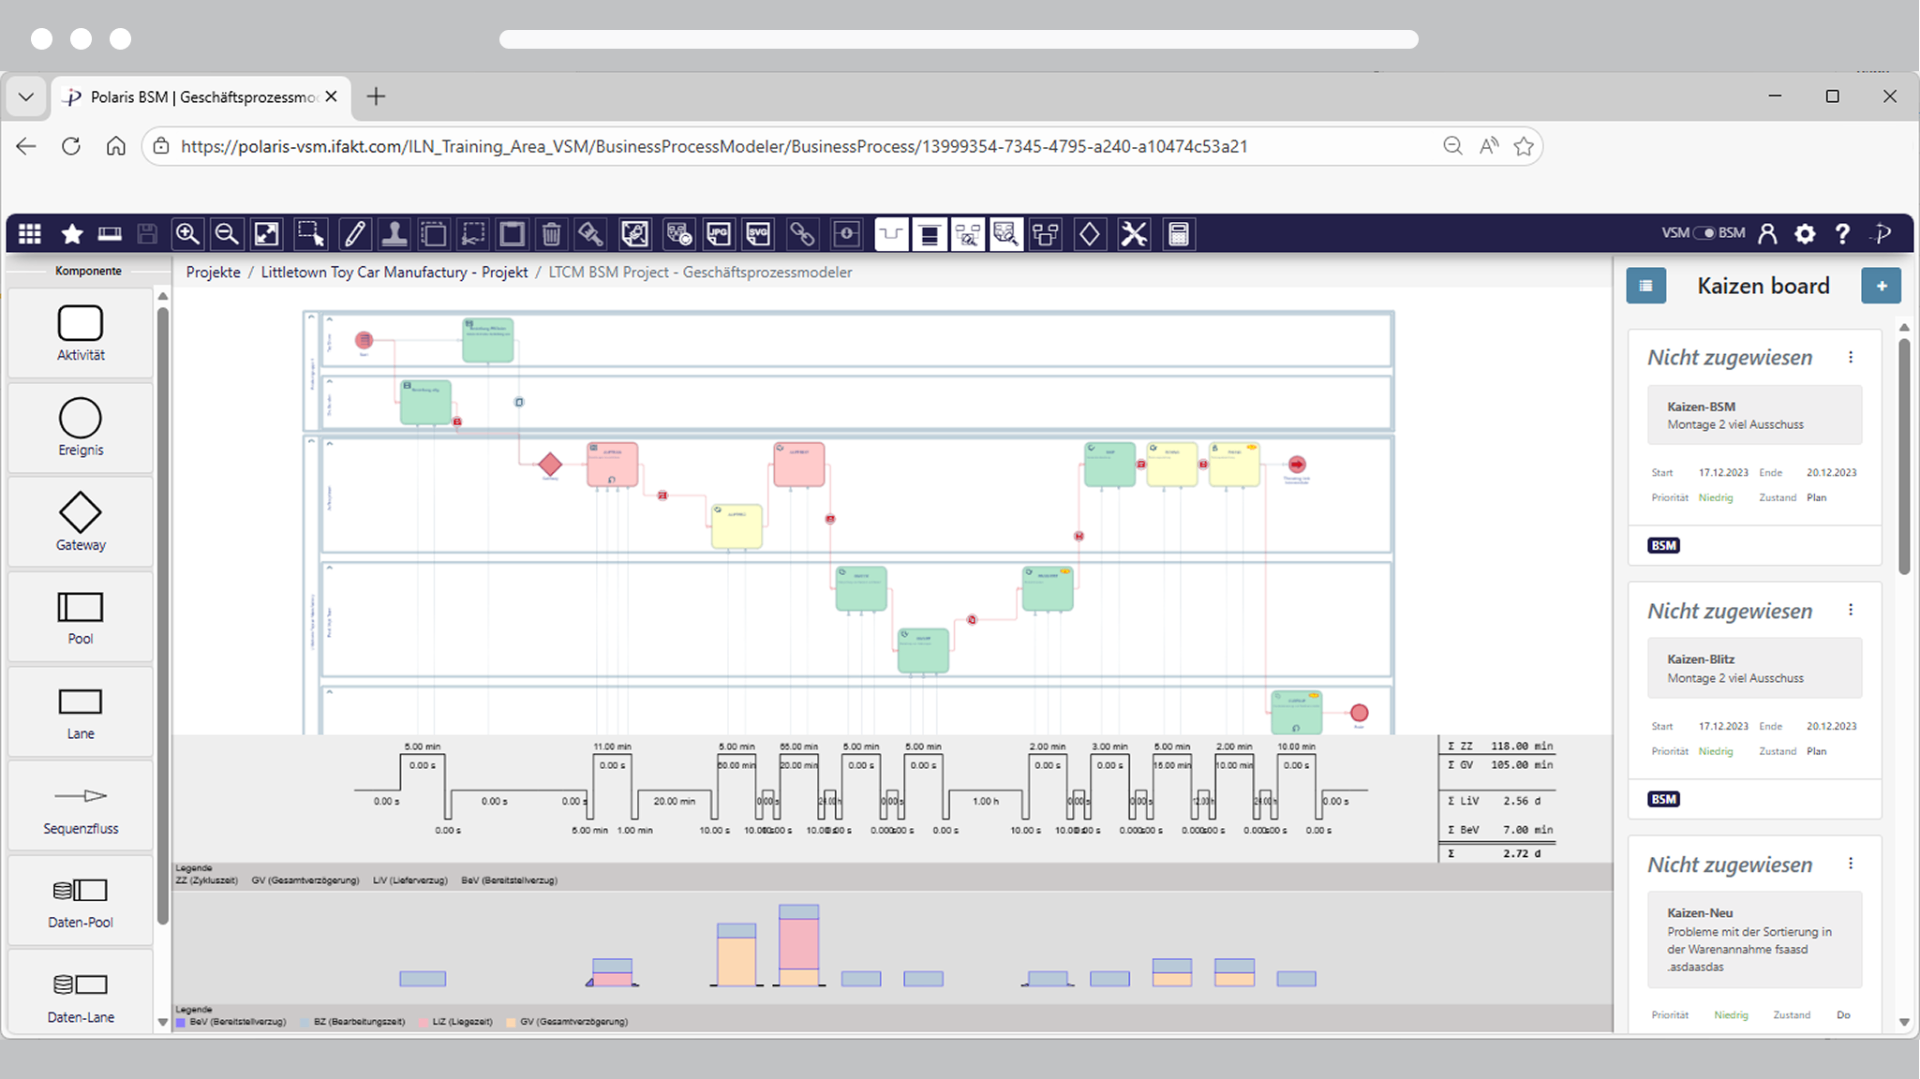
Digital Information Flows & Media Break Detection
Polaris BSM is your digital tool for business process modeling. Map how information flows across your organization — from paper to digital systems — and uncover hidden inefficiencies and automation opportunities. Turn complex, disconnected processes into clear, optimized digital workflows. Polaris BSM helps you visualize data flows, detect media breaks (paper↔digital, system↔system), and identify where automation and improvements can deliver the most impact.
- Visualize data flows across your organization
- Detect media breaks (paper↔digital, system↔system)
- Turn complex, disconnected processes into clear workflows
- Identify where automation delivers the most impact
- Uncover hidden inefficiencies and optimization opportunities
Explore What Polaris BSM Can Do
Designed for Lean leaders, operations managers, and improvement teams
Model & Understand
Map processes with clarity using Pools and Lanes
Organize your processes intuitively with swimlanes. Model Pools as organizational containers, then add Lanes for roles, skills, or departments. Use built-in hide/show functionality to focus on what matters. Perfect for complex, multi-department workflows.
- Pools for organizational containers (departments, divisions)
- Lanes for detailed structure (roles, skills, responsibilities)
- Hide/show function for focused analysis
- Supports unlimited depth and complexity
Uncover hidden media breaks in your digital processes
Track how information moves through your processes. Model data objects, data stores, and information systems. Automatically visualize where media breaks occur (paper↔digital, system↔system handoffs) and pinpoint inefficiencies that slow you down.
- Extended Data Lanes for tracking information flow
- Data objects & data repositories mapping
- Media break visualization (paper↔digital, system↔system)
- Information system connections
- Identifies automation & digitalization opportunities
Visualize process durations on the critical path
See how long each activity takes and where delays accumulate. Timeline analysis shows activity durations on the critical path, plus pre- and post-delays. Quickly identify bottlenecks and understand which steps drive your total lead time.
- Activity duration visualization
- Critical path analysis
- Pre- and post-delay tracking
- Lead time decomposition
- Bottleneck identification
Balance workloads and identify capacity constraints
Stack your cycle time sources into visual bar charts. See who's overloaded, where bottlenecks exist, and what's causing imbalances. Operator Balance Chart breaks down every second—ideal for finding quick wins in process optimization.
- Stacked bar chart visualization of cycle time sources
- Operator/resource utilization analysis
- Bottleneck visualization
- Quick-win identification
- Data-driven rebalancing decisions
Automatic calculation of process metrics—no Excel needed
Get instant insights without manual calculations. Polaris BSM automatically computes critical path, lead time, cycle time, value-add percentages, and more. Every update recalculates instantly. Your data is always current and accurate.
- Automatic critical path computation
- Real-time KPI calculation (lead time, cycle time, throughput)
- 10+ standard process KPIs built-in
- 100% data accuracy (no manual errors)
- Custom KPI definitions possible
Identify waste and quantify optimization potential
Classify every activity as value-adding or non-value-adding. Calculate your value-add ratio end-to-end. See exactly where waste happens—waiting, rework, handoffs, approvals—and quantify the cost of each inefficiency. Data-driven improvement starts here.
- Value-adding vs. non-value-adding classification
- End-to-end value-add ratio calculation
- Waste cost quantification
- Efficiency metrics
- Bottleneck & constraint analysis
Optimization
Test improvements before you implement them
Model your target state. Compare current vs. future scenarios side-by-side. See KPI impact of proposed changes (automation, reallocation, new tools, process redesign). Quantify ROI and payback periods. Build a data-backed optimization roadmap with confidence.
- Unlimited scenario creation (Is-State, To-Be, Alternative A, B, C...)
- Impact analysis for each change
- Automation potential assessment
- Risk reduction through testing before implementation
Continuous Improvement
Capture and track improvement opportunities in real-time
Create Kaizen cards directly while mapping processes. Every improvement idea is instantly linked to the process map, making it visible to the entire team. Organize Kaizens into PDCA or DMAIC cycles, enriched with details, ownership, timelines, and interdisciplinary tracking—from discovery to implementation.
- Inline Kaizen card creation during process mapping
- Automatic linking to process activities
- PDCA and DMAIC cycle management
- Enriched Kaizen details (description, impact, resources, timeline)
- Cross-functional team collaboration and tracking
- Improvement status visibility and portfolio management
Security & Compliance
100% cloud-based & secured
Start your work immediately, with cloud- and web-based browser application without complex and local installation. Access your value stream projects from any device, regardless of location and at any time.
- Hosted on Microsoft Azure West Europe
- OAuth 2.0 security
- ISO 27001 certified
- ISO 9001 certified
- 100% DSGVO-compliant
- Isolated tenant environments
Ready to Transform Your Operations?
Get started with a free trial or schedule a personalized demo with our team.