Digitize and Analyze Your Business Processes with BPMN and Lean Methods
Polaris BSM enables teams to model cross-departmental processes, analyze lead times, and identify bottlenecks in administrative workflows.
Trusted by leading companies in Aerospace, Automotive & Engineering







Why Traditional Business Process Mapping Fails
PowerPoint, Visio and manual tools can't keep up with process complexity.
Static Diagrams
PowerPoint and Visio create static process diagrams that are outdated the moment they're finished. Every change means rebuilding from scratch.
Invisible Media Breaks
Information flows between paper, email, ERP, and manual handoffs are invisible in traditional tools — making digitalization gaps impossible to find.
No Process KPIs
Without automatic KPI calculation, process performance remains guesswork. Lead times, value-add ratios, and bottlenecks stay hidden.
A Data-Driven Approach to Business Process Mapping
Polaris BSM connects swimlane modeling, data flow analysis, and continuous improvement in one platform — so your process maps are always live, always accurate, and always actionable.
How Polaris BSM Works
From process modeling to measurable improvement in three steps.
Model Business Processes
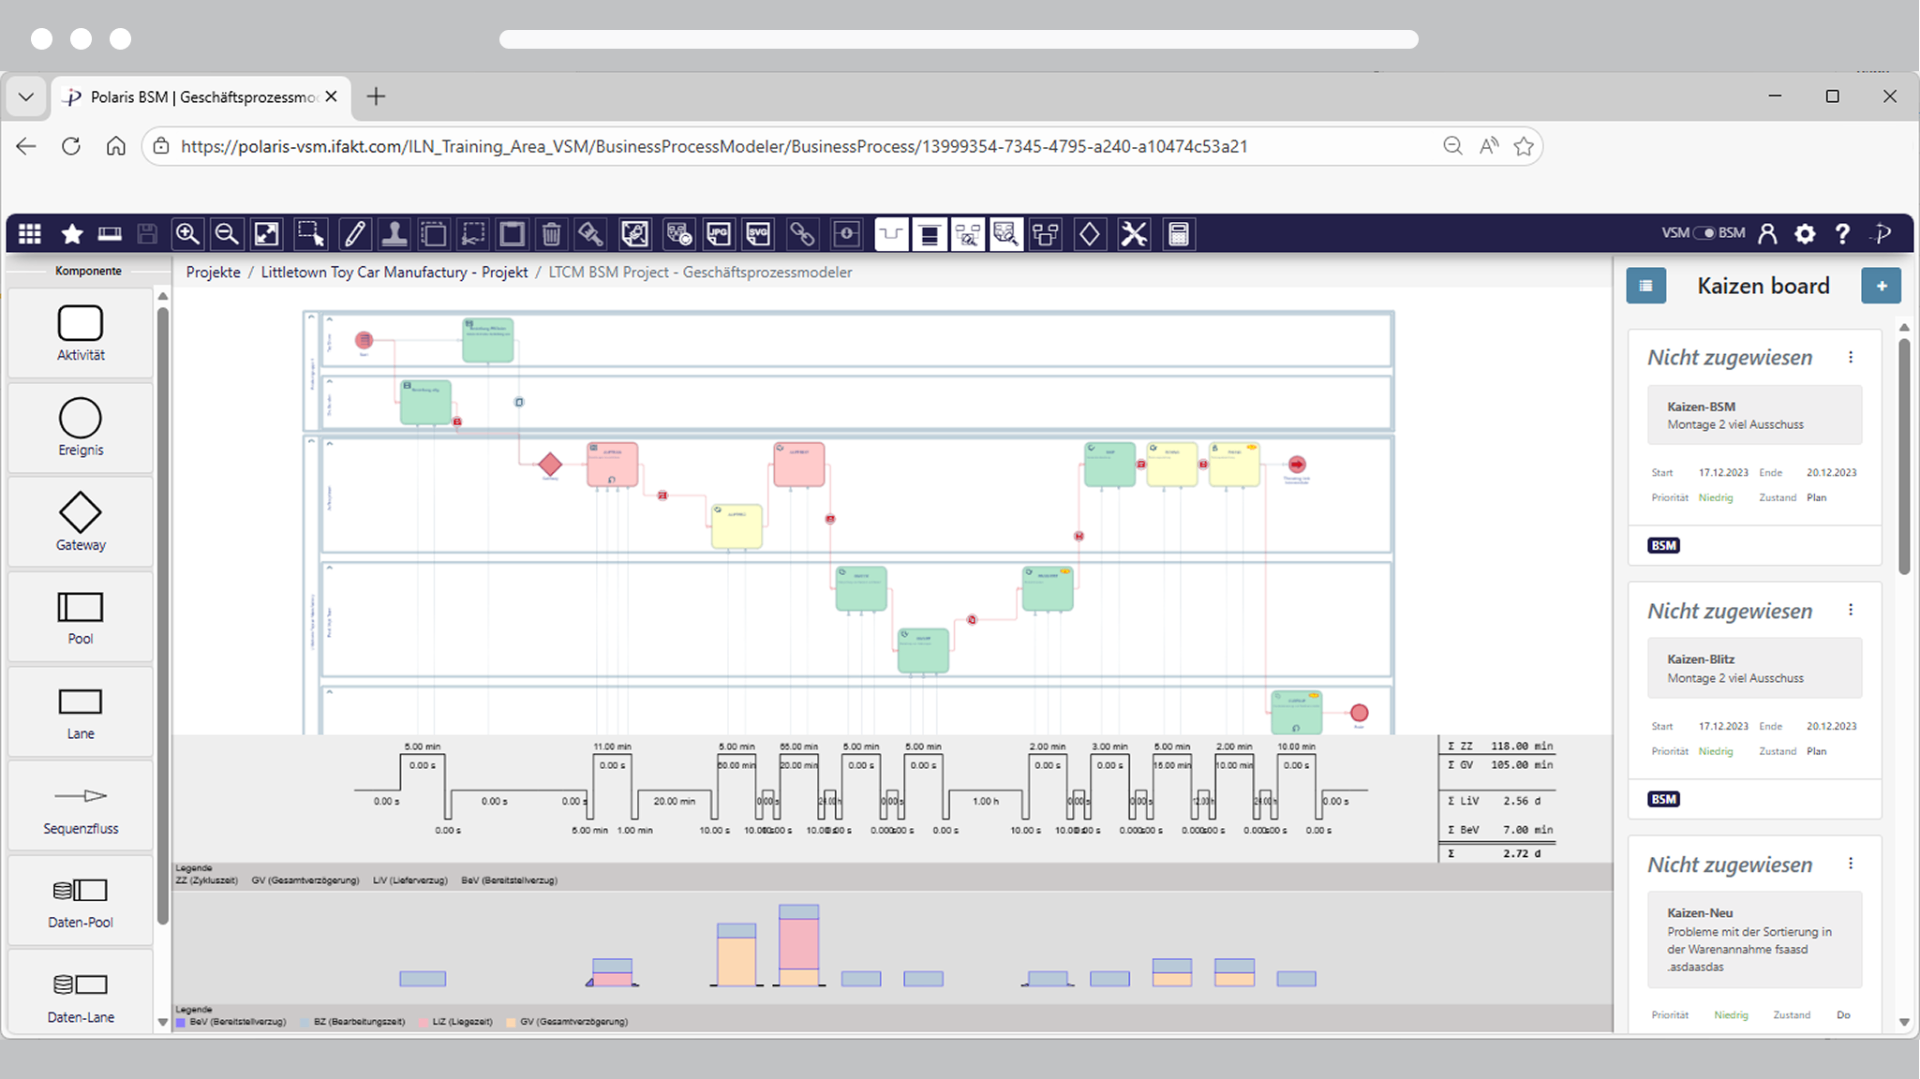
Create digital swimlane diagrams combining BPMN elements with lean process structures to make responsibilities and workflows visible across departments.
Analyze Process Performance
Add time data, analyze process lead times, identify critical paths, and uncover inefficiencies in administrative processes.
Identify Improvement Potential
Compare process variants and identify opportunities to reduce lead times and increase process efficiency.
Everything You Need for Digital Process Mapping
From swimlane modeling to continuous improvement — in one integrated platform.
Intuitive Swimlane Process Mapping
Organize processes with Pools (departments, divisions) and Lanes (roles, skills). Use hide/show functionality to focus on what matters — perfect for complex, multi-department workflows.
- Pools for organizational containers
- Lanes for roles, skills, and responsibilities
- Hide/show function for focused analysis
- Supports unlimited depth and complexity
Uncover Hidden Media Breaks
Track how information moves through your processes. Model data objects, data stores, and information systems. Automatically visualize where media breaks occur (paper↔digital, system↔system).
- Extended data lanes for information flow tracking
- Data objects & data repositories mapping
- Media break visualization (paper↔digital)
- Identifies automation & digitalization opportunities
Visualize Process Durations on the Critical Path
See how long each activity takes and where delays accumulate. Timeline analysis shows activity durations, pre- and post-delays, and the critical path — so you can identify bottlenecks instantly.
- Activity duration visualization
- Critical path analysis
- Pre- and post-delay tracking
- Bottleneck identification
Balance Workloads and Identify Capacity Constraints
Stack cycle time sources into visual bar charts. See who's overloaded, where bottlenecks exist, and what's causing imbalances — ideal for quick wins in process optimization.
- Stacked bar chart visualization
- Operator/resource utilization analysis
- Bottleneck visualization
- Quick-win identification
Automatic KPI Calculations — No Excel Needed
Get instant insights without manual calculations. Polaris BSM automatically computes critical path, lead time, cycle time, value-add percentages, and more — always current, always accurate.
- Automatic critical path computation
- Real-time KPI calculation
- 10+ standard process KPIs built-in
- 100% data accuracy (no manual errors)
Identify Waste and Quantify Optimization Potential
Classify every activity as value-adding or non-value-adding. Calculate your value-add ratio end-to-end and see exactly where waste happens — waiting, rework, handoffs, approvals.
- Value-adding vs. non-value-adding classification
- End-to-end value-add ratio calculation
- Waste cost quantification
- Bottleneck & constraint analysis
Measurable Business Outcomes
Teams using Polaris BSM see real improvements across their business processes.
Process Lead Time Reduction
Reduce administrative lead times by identifying media breaks, eliminating handoff delays, and streamlining information flows.
Faster Process Mapping
Complete process mapping projects in a third of the time compared to traditional PowerPoint and Visio methods.
Digital Process Coverage
Map and optimize your entire business process landscape digitally — from discovery to verified improvement.
Built for Your Process Optimization Use Case
Administrative Process Optimization
Map and optimize administrative workflows across departments — from order-to-cash to procure-to-pay.
Digital Transformation
Identify digitalization opportunities by uncovering media breaks and manual handoffs in your information flows.
Process Standardization
Standardize business processes across locations and departments with clear, data-driven swimlane maps.
Trusted by Leading Organizations
Global companies use Polaris BSM to digitalize their business processes.

Digital Process Mapping
"Thanks to the coaching provided by iFAKT GmbH, we have made significant progress in our digitalization strategy! The technical expertise and the professional delivery of theoretical knowledge through practical examples created real added value for us and elevated our process work to a new level."
Andreas Brandt
Logistics Manager – Siemens Energy, Switchgear Factory Berlin
More Than a BPMN Modeling Tool
Polaris BSM goes beyond process diagrams — it's a platform for analyzing and improving your business processes.
| Feature | Polaris BSM | ARIS | Lucidchart | Microsoft Visio |
|---|---|---|---|---|
| Process Modeling | ||||
| Native KPI Evaluation in Process Model | ||||
| Software-Supported Critical Path Analysis | ||||
| Native Process Lead Time Calculation | ||||
| Native BPMN and Lean Methodology Integration | ||||
| Process Data Flow Visualization | ||||
| Collaboration for Process Improvement | ||||
| Continuous Process Improvement Support |
Try Polaris BSM for Free
Learn how you can analyze business processes with Polaris