Our Solutions
Discover our comprehensive Industry 4.0 solutions for your digital transformation.
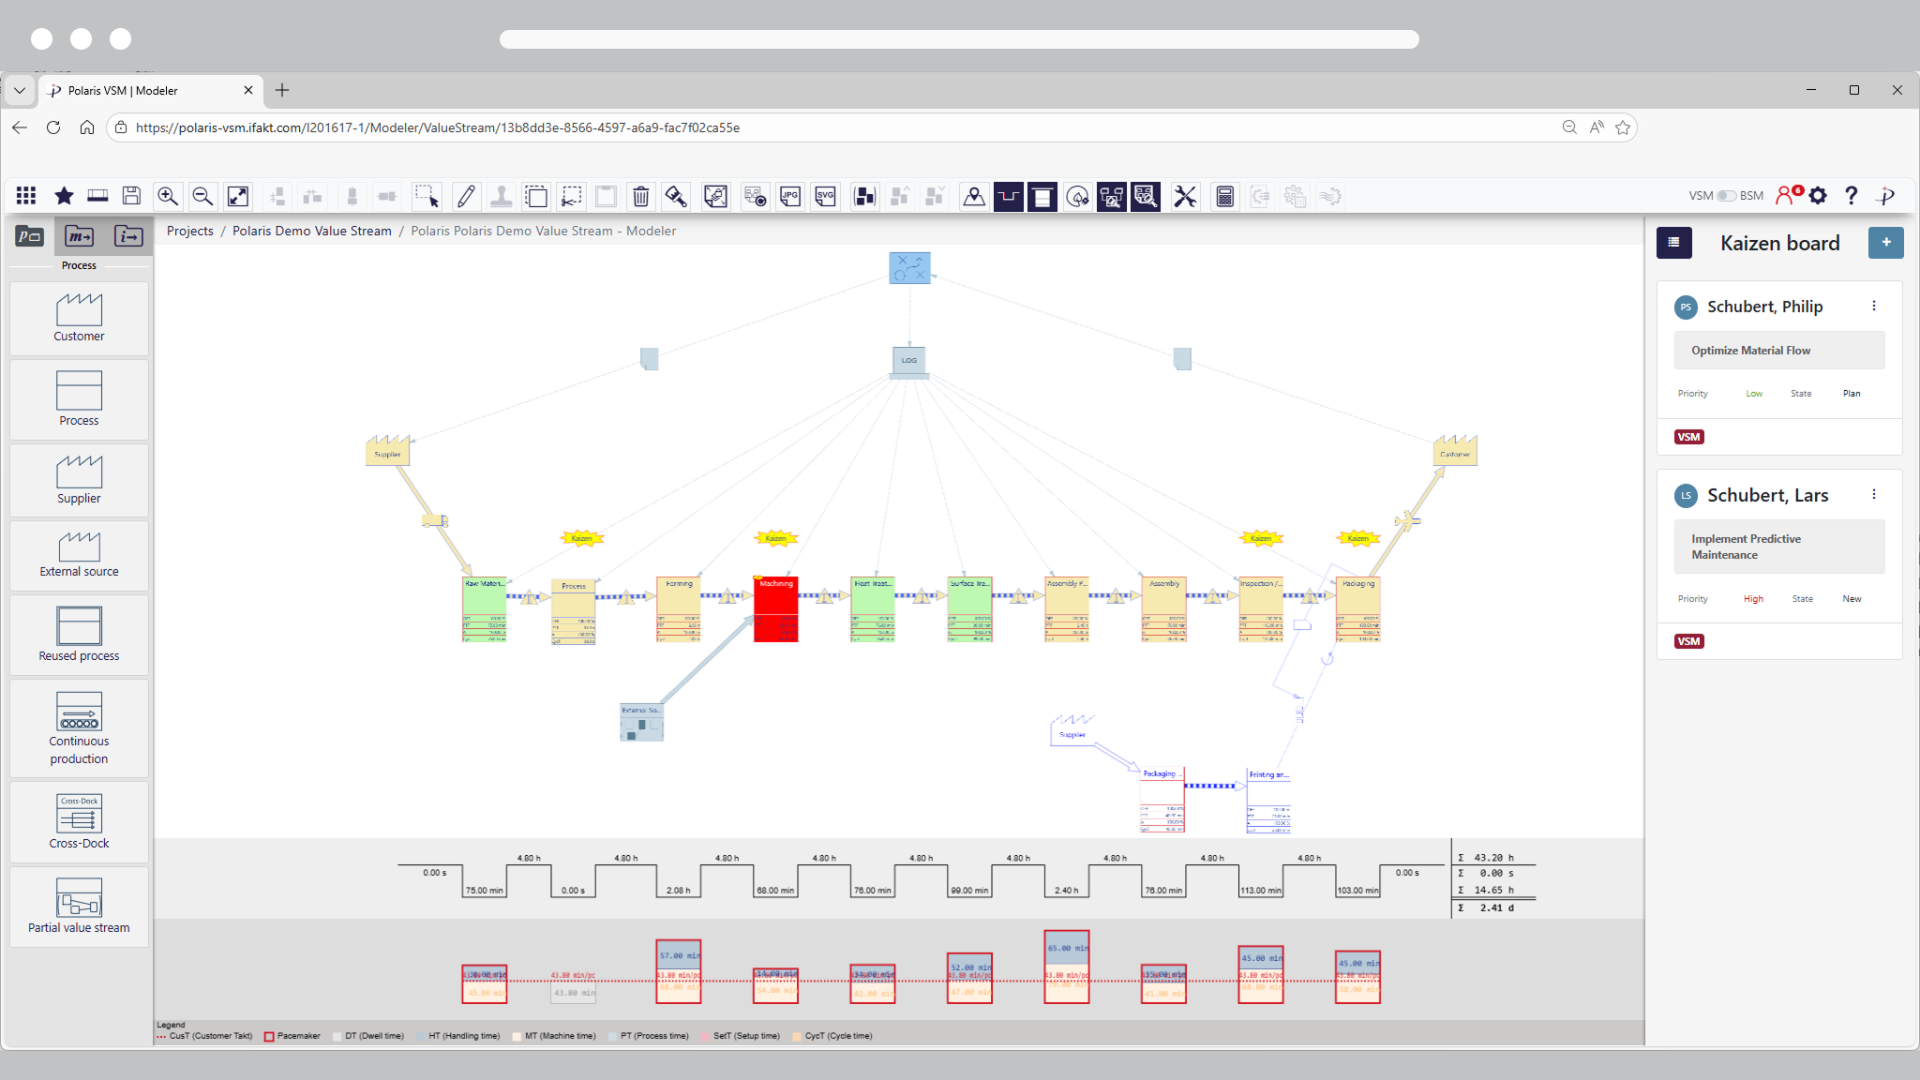
The fastest way to make your value stream visible
Reveal how work truly flows, identify bottlenecks in seconds, and design optimized future states — without paper, Excel, or complexity. Polaris VSM provides a scalable, collaborative, and standardized method for analyzing, evaluating, and optimizing complex value streams.
- Automatic capture of material and information flows
- Real-time visualization of the entire value chain
- Identification of waste and bottlenecks
- Collaborative editing with your team
- Export in various formats for presentations
Explore What Polaris VSM Can Do
Designed for Lean leaders, operations managers, and improvement teams
Design & Analyze
Model value streams in minutes, not days
Create digital value streams intuitively with drag-and-drop simplicity and consistent Touchscreen optimized, 100% browser‑based Software. Supports multiple levels of detail, including Timeline, Yamazumi, and several customization options.
- 50+ predefined Lean symbols
- Alignment, mini-map, thumbnails, Editor for almost everything
- Color-coding, standardized or individual
- Complete VSM in 2-4 hours (vs. 2-3 days brown paper & Excel)
Automated KPI Calculation – no more Excel
Automatic calculation of 25+ standard VSM KPIs: lead time, value-added ratio, inventory, OEE, takt time vs. cycle time, and more. Updates instantly when you need it.
- 25+ standard value stream mapping KPIs
- 100% data accuracy (no manual Excel errors)
- Flexibility and bottleneck indicators
- Custom KPI definitions & formulas possible
Decide & Simulate
Test scenarios before you implement
Duplicate your value stream and test changes without impacting production. Create unlimited scenarios (new equipment, reduced labor, improved workflow) and compare ROI VSM-by-VSM.
- Unlimited scenario creation (A, B, C, D…)
- Sensitivity analysis (What if one parameter changes?)
- Scenario history & rollback with revisions
- Side-by-side KPI comparison
- 30-40% implementation risk reduction
Multi-Level Value Stream Structure
Hierarchical multi-level structure: End-to-end value stream (Level 1) → Sub-processes (Level 2) → Detailed operations (Level 3). Drill down for details, KPIs aggregate upward.
- Use hierarchy levels for deep analysis
- One-click drill-down navigation
- Aggregate KPIs from Level 3 → Level 1
- Perfect for complex supply chains & OEMs
Collaborate & Improve
Team participation everywhere
Built for teams from day one. World-wide collaboration with role-based permissions (Admin, Editor, Viewer). Shop floor workers input data, Lean managers review, leadership sees dashboards.
- Role-based access control (multi-tenant architecture)
- Multiple users can edit the value streams
- Version history, change tracking & multi-project workflows
- Integrated documentation of improvement actions (PDCA)
- Export of reports, metrics, and process documentation
Capture and track improvement opportunities in real-time
Create Kaizen cards directly while mapping processes. Every improvement idea is instantly linked to the process map, making it visible to the entire team.
- Inline Kaizen card creation during process mapping
- Automatic linking to process activities
- PDCA and DMAIC cycle management
- Enriched Kaizen details (description, impact, resources, timeline)
- Cross-functional team collaboration and tracking
- Improvement status visibility and portfolio management
Connect & Report
Combine manual Gemba insights with system data
Create the complete Picture! Establish imports from ERP, MES, BDE, and Data Warehouse systems with the Polaris IIoT Gateway. Export KPI data to Excel for further analysis if needed.
- Imports from ERP, MES, BDE, and Data Warehouse systems
- Hybrid approach: system data + manual observations from shop-floor
- Multi-format export (JPEG, Excel, SVG)
- Encrypted Export for archiving
Executive-ready dashboards
Role-specific dashboards: Lean Manager (project portfolio), Plant Manager (line performance), CFO (ROI tracking). Real-time KPI updates, drill-down capability, automated alerts on thresholds.
- Pre-built dashboards
- Line performance
- Drill-down capability
- Intelligent knowledge graph structure
- AI-Support
Security & Compliance
100% cloud-based & secured
Start your work immediately, with cloud- and web-based browser application without complex and local installation. Access your value stream projects from any device, regardless of location and at any time.
- Hosted on Microsoft Azure West Europe
- OAuth 2.0 security
- ISO 27001 certified
- ISO 9001 certified
- 100% GDPR-compliant
- Isolated tenant environments
Ready to Transform Your Operations?
Get started with a free trial or schedule a personalized demo with our team.