Excel to Value Stream: New Polaris Feature for Automated Value Stream Mapping
Thank you to everyone who joined our recent webinar on automated Value Stream Mapping with Polaris. We were excited to see the strong interest and the many insightful questions from Lean, Continuous Improvement, and Operations teams.
During the session, we introduced a new Polaris feature that enables users to automatically generate a Value Stream Map directly from Excel data. This feature is now available and can already be tested inside Polaris.
Excel to Value Stream: How the Feature Works
With the new Excel import functionality, Polaris makes it significantly easier to transform operational data into a visual value stream.
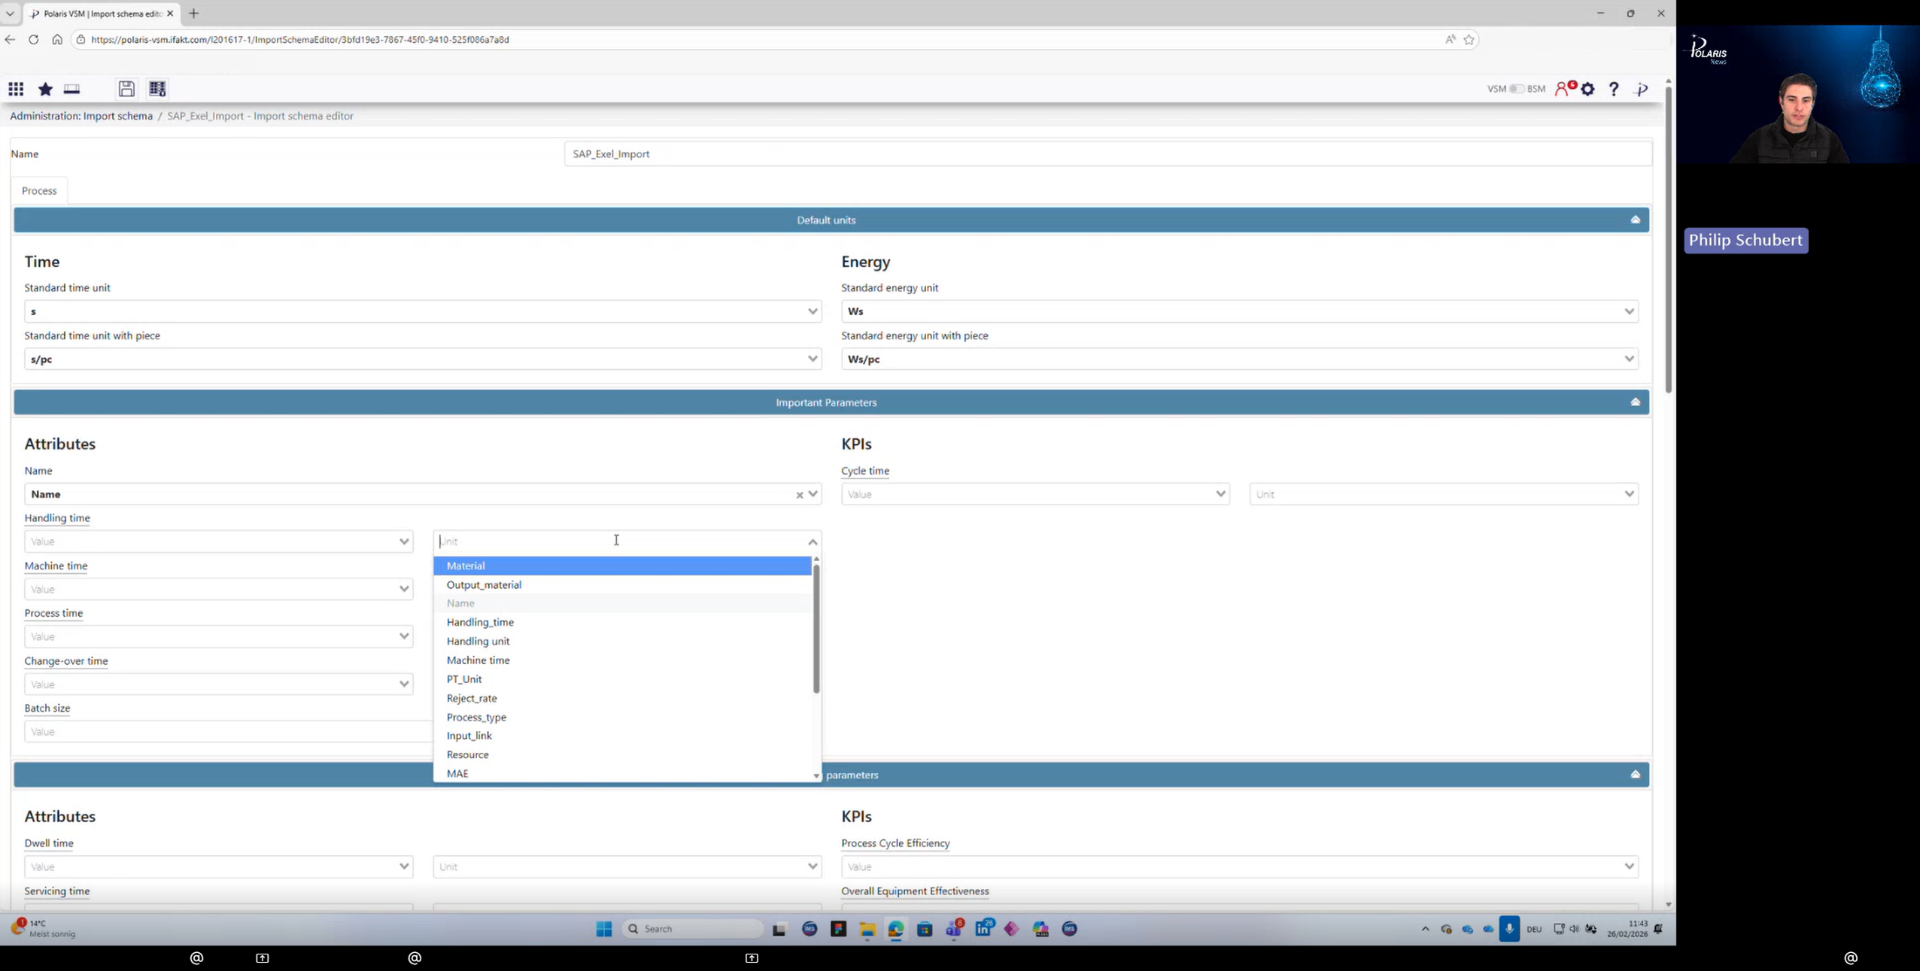
The process works by defining an import schema based on the structure of an Excel file. This schema describes how the Excel columns and data fields correspond to elements in the value stream, such as process steps, cycle times, waiting times, or material flows.
Once a schema is created, it can be reused for future Excel imports. This means teams only need to configure the mapping once and can then repeatedly import updated data to generate a new value stream automatically.
Users can also create multiple schemas for different Excel formats or data structures. This makes it possible to support different plants, production lines, or data exports from systems such as SAP that are exported to Excel.
With this approach, Polaris enables teams to quickly transform operational data into a visual and analyzable value stream without manually rebuilding the entire model.
What is Value Stream Mapping?
Value Stream Mapping (VSM), also known as Wertstromanalyse in Lean management, is a method used to visualize and analyze the flow of materials and information across a production or service process.
The goal of value stream analysis is to identify inefficiencies, waiting times, bottlenecks, and improvement opportunities along the entire process chain. By visualizing the complete process flow, teams can better understand where time and resources are lost and where improvements will have the greatest impact.
In many organizations, creating a value stream map still requires significant manual effort. Processes are often mapped manually in workshops or built step by step in diagram tools or spreadsheets.
How Polaris Supports Data-Driven Value Stream Analysis
Polaris brings Value Stream Mapping into a more data-driven and scalable environment.
By automatically generating value streams from structured data such as Excel exports, Polaris enables teams to quickly move from raw operational data to a visual value stream representation. This allows organizations to identify bottlenecks faster, evaluate process performance, and support continuous improvement initiatives based on real operational data.
Instead of spending days or weeks building value stream maps manually, teams can now focus on analyzing the value stream and implementing improvements.
Try the Feature
The new Excel-to-Value-Stream functionality is now available in Polaris and can already be tested.
We look forward to seeing how Lean teams, process engineers, and operations managers use this feature to accelerate their Value Stream Mapping and value stream analysis initiatives.